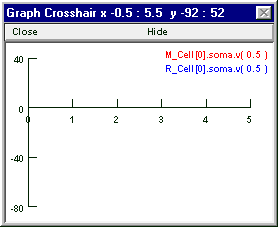
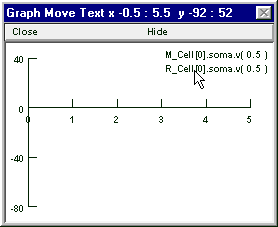
How to move the labels
Use the graph’s Move Text function to reposition the labels so they are completely visible. Select Move Text from the graph’s primary menu.
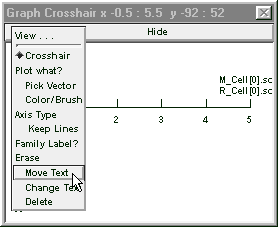
Left click on a label and hold the mouse button down . . .
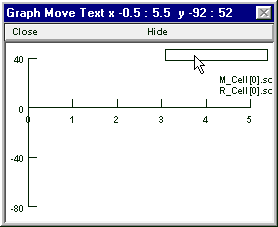
Release the curor and the label reappears in the new location.
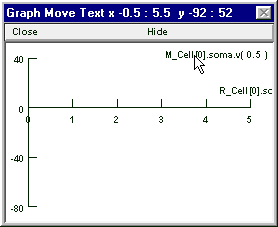
Repeat for the other label.
How to change the colors of the plots
Use color to make the responses of the two cells easy to distinguish from each other. Select Color/Brush from the graph’s primary menu.
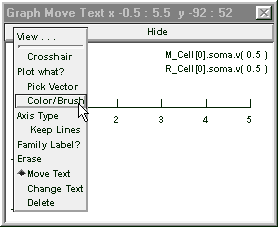
This pops up a color & linestyle palette. Click on the radio button next to the red line in the left column.
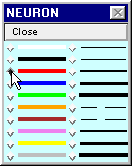
Click on one label and note the change in color.
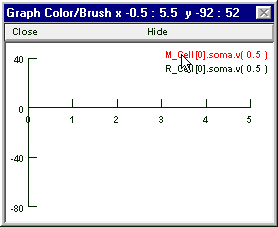
Go back to the palette and select blue. Then click on the other label. When you’re done, restore Crosshair mode!