- RangeVarPlot
- begin · color · end · from_vector · left · list · origin · plot · right · to_vector · vector
RangeVarPlot
- class RangeVarPlot
- Syntax:
h.RangeVarPlot("rangevar" [, start_segment, stop_segment])h.RangeVarPlot(py_callable [, start_segment, stop_segment])- Description:
Class for making a space plot. eg. voltage as function of path between two points on a cell. Specification of the start and stop segments is optional, but if one is specified both must be specified.
For Interviews plotting, an object of this type needs to be inserted in a Graph with
g.addobject(rvp). Alternatively, in NEURON 7.7+, the RangeVarPlot’s plot method can be used to plot a snapshot of the values on a Graph object, a bokeh plot, a matplotlib plot, or anything with a compatible interface to the last two. By default, the location of the path nearest the root is location 0 (the origin) of the space plot.If the rangevar does not exist at certain places in the path it is assumed to have a value of 0.
The first form where rangevar is “v” or “m_hh”, etc. is very efficient since the object can store pointers to the variables for fast plotting.
The second form is much slower since the expression must be executed by the interpreter for each point along the path for each plot. Execution of the expression is equivalent to
for sec in h.allsec(): for seg in sec: f(seg.x)where the expression is the body of f. All section-dependent NEURON functions will default to the correct section for the call; i.e. there is no need to saysec=unless you want to refer to a section that is not the one whose data is being plotted. The current section may be read viah.cas().In NEURON 7.7+, RangeVarPlot’s constructor takes optional begin and end arguments. In Python, these would typically be segments, but they can also be normalized position on a single segment.
See also
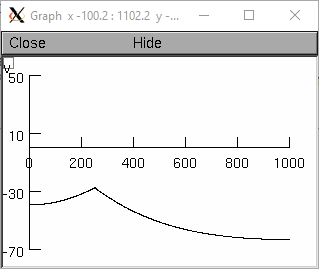
Example (plotting by name):
from neuron import h, gui

dend1 = h.Section(name='dend1')
dend2 = h.Section(name='dend2')

for sec in h.allsec():
    sec.nseg = sec.L = 501
    sec.diam = 1

dend2.connect(dend1)

ic = h.IClamp(dend1(0.5))
ic.amp = 0.5
ic.delay = 0
ic.dur = 1

h.finitialize(-65)
h.continuerun(1)

rvp = h.RangeVarPlot('v', dend1(0), dend2(1))
g = h.Graph()
g.addobject(rvp)
g.size(0, 1002, -70, 50)
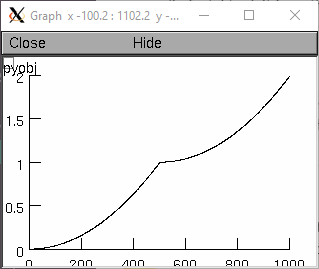
Example (plotting a function):
from neuron import h, gui

dend1 = h.Section(name='dend1')
dend2 = h.Section(name='dend2')

for sec in h.allsec():
    sec.nseg = sec.L = 501
    sec.diam = 1

dend2.connect(dend1)

def my_func(x):
    sec = h.cas()  # find out which section
    if sec == dend1:
        y = x ** 2
    else:
        y = 1 + x ** 2
    return y

rvp = h.RangeVarPlot(my_func, dend1(0), dend2(1))
g = h.Graph()
g.addobject(rvp)
g.size(0, 1002, 0, 2)
g.flush()
- Example (transfer impedance):
imp = h.Impedance()

rvp = h.RangeVarPlot(imp.transfer)
rvp... #specify range begin and end
imp... #specify impedance computation
g = h.Graph()
g.addobject(rvp)
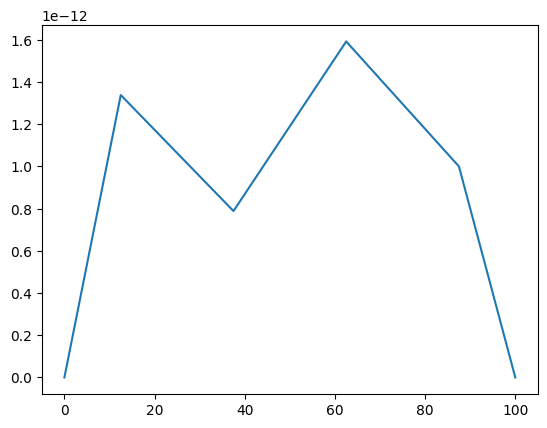
- Example (plotting a rxd species):
from neuron import h
from neuron import rxd
import matplotlib.pyplot as plt

dend1 = h.Section("dend1")
dend1.nseg =4

cyt1 = rxd.Region(dend1.wholetree(), nrn_region="i")
ca1 = rxd.Species(cyt1, name="ca1", charge=2, initial=1e-12)

ca1.nodes(dend1(0.1))[0].include_flux(40)
ca1.nodes(dend1(0.4))[0].include_flux(-25)
ca1.nodes(dend1(0.7))[0].include_flux(70)

h.finitialize(-65)
h.dt /= 512
h.load_file("stdrun.hoc")
h.continuerun(0.025)

a_1 = h.RangeVarPlot(ca1, dend1(0), dend1(1))
a_1.plot(plt)
plt.show()
- RangeVarPlot.plot()
- Syntax:
rvp.plot(graph_object)rvp.plot(graph_object, arg1, ..., kwarg1=val1, ...)- Description:
In NEURON 7.7+, RangeVarPlot.plot plots the current state of the path on any of a number of types of graphs, including NEURON Graph objects, matplotlib, bokeh, and anything with a .plot or .line method taking x and y values. Any additional arguments or keyword arguments are passed to the graph’s plotting method.
- Example:
Plotting to a matplotlib axis (instead of pyplot itself), bokeh, and NEURON’s Graph objects and passing optional arguments to each:
from neuron import h, gui
from matplotlib import pyplot
import bokeh.plotting as b
import math

dend = h.Section(name='dend')
dend.nseg = 55
dend.L = 6.28

#looping over dend.allseg instead of dend to set 0 and 1 ends
for seg in dend.allseg():
    seg.v = math.sin(dend.L * seg.x)

r = h.RangeVarPlot('v', dend(0), dend(1)) #Three argument constructor in 7.7+

#matplotlib
graph = pyplot.gca()
r.plot(graph, linewidth=10, color='r')

#NEURON graph
g = h.Graph()
r.plot(g, 2, 3)
g.exec_menu('View = plot')

#Bokeh
bg = b.Figure()
r.plot(bg, line_width=10)
b.show(bg)

pyplot.show()
- RangeVarPlot.begin()
- Syntax:
rvp.begin(segment)rvp.begin(x, sec=section)- Description:
Begins the path for the space plot at the specified segment. Using the first syntax is recommended in later code; the second is another way to specify the segment
section(x).
Note
Beginning with NEURON 7.7, one can also specify the beginning and ending segments in the RangeVarPlot constructor; e.g.
rvp = h.RangeVarPlot('v', soma(0), distal(1)
- RangeVarPlot.end()
- Syntax:
rvp.end(segment)rvp.end(x, sec=section)- Description:
Ends the path for the space plot at the specified segment. Using the first syntax is recommended in later code; the second is another way to specify the segment
section(x).
Note
Beginning with NEURON 7.7, one can also specify the beginning and ending segments in the RangeVarPlot constructor; e.g.
rvp = h.RangeVarPlot('v', soma(0), distal(1)
- RangeVarPlot.origin()
- Syntax:
rvp.origin(x, sec=section)- Description:
Defines the origin (location 0) of the space plot as
section(x). The default is usually suitable unless you want to have several rangvarplots in one graph in which case this function is used to arrange all the plots relative to each other.
- RangeVarPlot.left()
- Syntax:
rvp.left()- Description:
returns the coordinate of the beginning of the path.
- RangeVarPlot.right()
- Syntax:
rvp.right()- Description:
returns the coordinate of the end of the path. The total length of the path is
rvp.right() - rvp.left().
- RangeVarPlot.list()
- Syntax:
rvp.list(sectionlist)- Description:
append the path of sections to the
SectionListobject argument.
- RangeVarPlot.color()
- Syntax:
rvp.color(index)- Description:
Change the color property. To see the change on an already plotted RangeVarPlot in a Graph, the Graph should be
flush()ed.
- RangeVarPlot.vector()
- Syntax:
yvec = rvp.vector()- Description:
Copy the range variable values to a new
Vectoryvec. (len(yvec)will be equal to the number of range points.)- Note:
New in NEURON 8.0.
See also
- RangeVarPlot.to_vector()
- Syntax:
rvp.to_vector(yvec)rvp.to_vector(yvec, xvec)- Description:
Copy the range variable values to the
Vector()yvec. yvec is resized to the number of range points. If the second arg is present then the locations are copied to xvec. A plot ofyvec.line(g, xvec)would be identical to a plot usingg.addobject(rvp). Returns the number of range points.
See also
- RangeVarPlot.from_vector()
- Syntax:
rvp.from_vector(yvec)- Description:
Copy the values in yvec to the range variables along the rvp path. The size of the vector must be consistent with rvp.